

The history of business intelligence can be traced to the 1860s. During this time, data was first gathered and analyzed for actionable insights. Fast forward to today, businesses rely on data analysis to make sense of the vast pool of information and create strategies to propel themselves forward. Power BI and Tableau are two significant business intelligence technologies available in the market. Both share certain similar and distinct features. Businesses leverage these tools to gain insights and get ahead of their competition. But is one of them better than the other? Keep reading to find a detailed Power BI vs Tableau comparison and find the answer.
Also Read: What is a DIA?
What Is Power BI?

Power BI from Microsoft is a suite of business intelligence tools. These include apps, software services, and data connectors. It’s a cloud-based platform that consolidates data from various sources into a centralized dataset. This dataset (s) is then used for data visualization, evaluation, and analysis. Although a cloud-based platform, Power BI can also be used on-premise. Currently, there are three types of Power BI platforms:
- Power BI Desktop, a desktop application
- Power BI Service, software-as-a-service (SaaS)
- Power BI Mobile for Android and iOS devices.
Features of Power BI
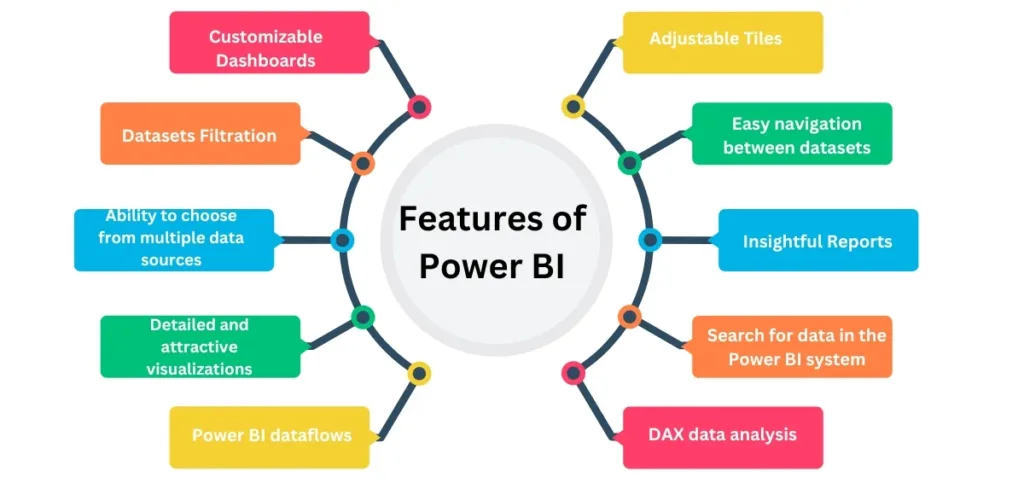
1. Detailed and attractive visualizations
Power BI provides a range of visualizations that help you gain a better understanding of data. The tool can create reports and dashboards through simple or complex visualizations. To create your visualizations, you can use the library available in the tool.
2. Ability to choose from multiple data sources
Power BI users can utilize the Get Data feature to choose from various data sources. The data sources are regularly updated, so there are always new sources to choose from. Some newly available data sources are as follows:
- Power BI dataflows
- Power BI datasets
- Excel
- Oracle
- JSON
- XML
- Azure
3. Datasets Filtration
A dataset refers to a set of data that is made by extracting data from a single or different data sources. It can be used to create different types of visualizations. Users can filter the datasets. Thus, they can have smaller subsets consisting of only relevant data. Power BI offers users various kinds of in-built data connectors. These include SQL, Excel, Azure, MailChimp, Facebook, and Oracle. You can connect to these sources and make datasets by importing data from a single or more source.
4. Customizable Dashboards
Dashboards refer to the collection of visualizations. These offer insights into data. Power BI dashboards consist of various visualizations as tiles. The dashboards can be shared or printed.
5. Adjustable Tiles
Tile refers to a block containing a visualization in a Power BI dashboard. Tiles help users by providing a clearer view of the data as they divide each visualization properly. Tiles in Power BI are extremely flexible. You can change their size and place them anywhere on the dashboard.
6. Easy navigation between datasets
In Power BI, the navigation pane has options for reports, dashboards, and datasets. Users find it easy to navigate between the dashboard, datasets, and the reports they are currently working on.
7. Insightful Reports
In Power BI, reports consist of different types of visualizations relevant to a specific business topic. These reports show a complete presentation of data in different ways. They reveal significant data insights. The reports are also shareable.
8. Search for data in the Power BI system
Power BI fulfills the search requirements of users through the Natural Language Q&A question box. Through this box, users can ask any questions in natural language to find data available in Power BI. Upon getting the user’s search query, Power BI’s cognitive engines search for the data and return it to the user.
9. DAX data analysis
The DAX functions are related to analysis. They are predefined codes that perform analytics that are particular to specific data functionalities. The DAX functions are regularly updated to provide a better user experience.
What Is Tableau?

Tableau is another commonly used data intelligence tool. It majorly helps users with data discovery, data visualization, and insight sharing. One of the main reasons for its popularity is that anyone can work on the tool. The learning curve isn’t too steep and even a non-tech-savvy person can use it to create dashboards and analyze reports. Tableau allows you to generate graph-like data representations by querying spreadsheets, cloud databases, social databases, and machine learning algorithms.
Features Of Tableau
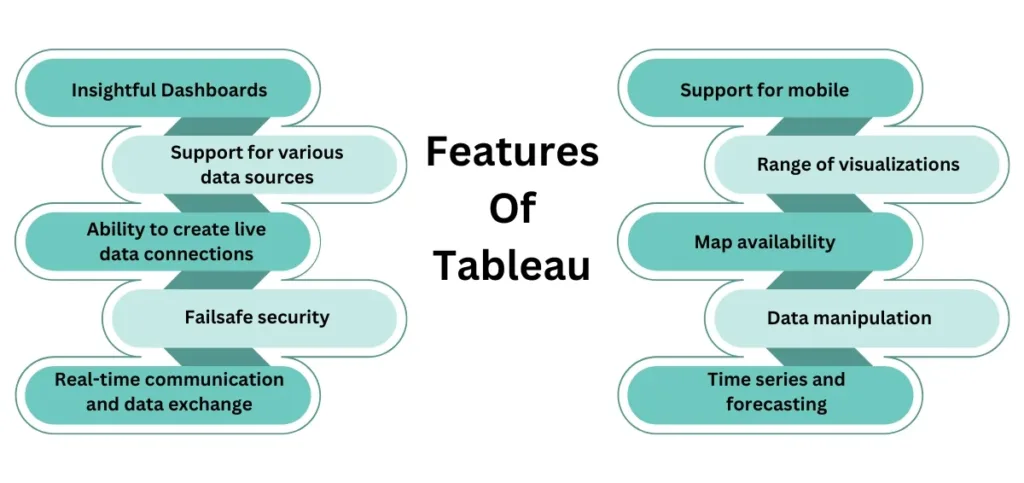
1. Insightful dashboards
The dashboards in Tableau are quite informative as they represent data in the form of stories. Tableau provides various layouts and dashboard styles. Users can also apply specific filters and duplicate a dashboard or its features from one to another worksheet. Overall, Tableau dashboards combine text, visual objects, and images to provide a complete view of your data.
2. Support for various data sources
Tableau supports several data sources. These include spreadsheets, local files, relational and non-relational databases, on-cloud data, Big Data, and Data Warehouses. Users can connect any data source and combine it with data from other sources to produce a combinatorial perspective of data.
3. Ability to create live data connections
Tableau provides in-memory data connection to external and live data sources. So, users can combine data from different sources and create live data connections. By doing so, you can consume data directly from the data source. Alternatively, you can maintain data in memory by taking data from a data source as per your needs.
4. Failsafe security
Tableau offers a high level of data protection. Its security system is based on authorization and authentication mechanisms. It also uses row-level filtering for data security.
5. Real-time communication and data exchange
Tableau makes it easy for users to communicate and exchange data. Users can do this as dashboards, sheets, and visualizations. You can communicate data from hybrid, cloud, and on-premise data sources.
6. Support for mobile
Tableau offers a mobile version of its app. Users can adjust mobile layouts for their dashboards as per their devices. The tool offers much scope for customization. Users can add attractive offline previews, new layouts, and more.
7. Range of visualizations
Tableau provides a wide range of visualizations. From simple ones like pie charts to complex ones like Motion Gantt charts and histograms, there are endless options.
8. Map availability
Tableau has insightful and comprehensive maps. The tool has extensive preinstalled map data. This includes administrative borders, postal codes, cities, and more. Additionally, it offers types of maps, such as Choropleth maps, flow maps, heat maps, and more.
9. Data manipulation
Tableau eases data manipulation through its Ask Data tool. It lets you perform basic Google searches and get useful replies. The responses are presented in both text and graphics. For instance, if your query is already in a bar graph or a chart, the Ask Data tool will look for it and open it for you.
10. Time series and forecasting
Time series and forecasting in Tableau can be done by creating trendlines and forecasts. It’s easy to create them through Tableau’s back-end and front-end. To get data predictions, all you need to do is pick specific parameters and drag-drop operations employing your particular fields.
Read Also: Team Building Exercises for Work
Areas Where Power BI Differs From Tableau

There are significant differences between Power BI and Tableau. Find out about them below.
Ease of usage
Tableau can be used by anyone. Its intuitive interface and drag-and-drop functionality make it user-friendly. Contrarily, Power BI has a steep learning curve. It is more suited for advanced users.
Price difference
Tableau is an expensive tool. It is best suited for large-sized enterprises. Power BI, on the other hand, is more affordable. It also has a free version.
Data integration
Tableau can connect to various data sources, including cloud-based and web services. Power BI is a product by Microsoft. So, it is more integrated with Microsoft products.
Level of customization
Tableau offers a range of customization options for visualizations and dashboards. You cannot find these many options in Power BI.
Features to collaborate
Tableau offers a range of collaboration features. You can create and share dashboards with others. Power BI also offers built-in collaborative features, such as commenting and co-authoring. However, it is more focused on a single-user analysis.
Ownership
Tableau is a product by Salesforce. It is licensed on a per-server basis. Power BI is licensed on a per-user basis.
Mobile support
Tableau’s mobile app is somewhat restricted in its features. On the other hand, Power BI’s app provides full support for Android and iOS devices.
Power BI Vs. Tableau – Which Should You Choose?
Both Power BI vs Tableau are effective at data visualization. However, choosing one mainly depends on the system that you will use it on and how much data you work with. Power BI is more suitable for Microsoft-centric environments. Tableau is ideal for large-scale organizations with advanced customization requirements. The choice also depends on the cost of the tool. If you haven’t had prior experience with any of them, it’s best to learn using both. It will help you to make the right choice.
Final Thoughts
Both Power BI vs Tableau offer effective data visualization and analysis capabilities. Power BI integrates well with Microsoft products and is more affordable, while Tableau excels in advanced customization. Ultimately, the choice depends on your distinct organizational needs, system compatibility, and budget. Exploring both options is ideal to make an informed decision.